The Anderson and Cornell groups have adapted two statistical techniques used in astronomical data processing to the analysis of images of ultracold atom gases. Image analysis is necessary for obtaining quantitative information about the behavior of an ultracold gas under different experimental conditions. Until now, the preferred method has been to find a shape (such as a Gaussian) that looks like the results and write an image-fitting routine to probe a series of photographs. The drawback is that information extracted this way will be biased by the model chosen.
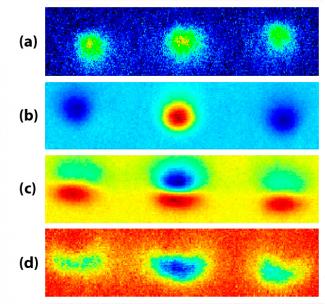
The two groups recently employed model-free analysis techniques to extract results from interferometry experiments on Bose-Einstein condensates (BECs). The statistical processing techniques were able to rapidly pinpoint correlations in large image sets, helping the researchers uncover unbiased experimental results. Using the techniques, graduate student Steve Segal, former graduate student Quentin Diot, Fellows Eric Cornell and Dana Anderson, and a colleague from Worcester Polytechnic Institute calibrated their interferometer, identified and mitigated some noise sources, and unearthed signal information partially buried in the noise generated during the BEC experiment. By looking for correlations and relationships between pixels in a series of images (a), the researchers were able to clearly "see" changes in the overall number of atoms (d), changes in the vertical positions of three peaks in a momentum distribution (c), and changes in the fraction of atoms in the central peak (b), which was the primary experimental signal.
The results were obtained with principal component analysis (PCA) and independent component analysis (ICA). PCA identified simple pixel correlations and looked for areas of maximum variance. Such areas provided an idea about where to look for changes in size, structure, or position of the ultracold atom cloud. The PCA analysis was sufficient for calibrating the interferometer and debugging the experiment. It also provided an idea of size changes in one or more features of the experiment. However, the PCA analysis alone wasn’t perfect. ICA was required to extract the most important information about the experiment, i.e., the fraction of the total number of atoms in one of three clouds. Using preprocessed data from a PCA analysis, ICA was able to test whether the values of neighboring pixels were statistically independent from one another. With this information, ICA could then determine relative differences in the experimental signal and separate its individual features.
Segal thinks physicists in the ultracold atomic physics field will be intrigued by the potential of using the PCA and ICA techniques to probe their experimental images. There are only two caveats: The techniques require 10–100 images, and their application to ultracold atom-cloud experiments is still in its infancy. - Julie Phillips


 The Physics Frontiers Centers (PFC) program supports university-based centers and institutes where the collective efforts of a larger group of individuals can enable transformational advances in the most promising research areas. The program is designed to foster major breakthroughs at the intellectual frontiers of physics by providing needed resources such as combinations of talents, skills, disciplines, and/or specialized infrastructure, not usually available to individual investigators or small groups, in an environment in which the collective efforts of the larger group can be shown to be seminal to promoting significant progress in the science and the education of students. PFCs also include creative, substantive activities aimed at enhancing education, broadening participation of traditionally underrepresented groups, and outreach to the scientific community and general public.